Why chicken breast protein numbers vary so much
You pull a chicken breast from the package expecting the usual “about 25–30 grams of protein,” then the scale shows something oddly big—or oddly small. That’s where the numbers start drifting. Chicken breasts aren’t standardized portions: some are thick and heavy, some are trimmed aggressively, and some include little extras like bits of tenderloin or more surface fat left on.
Then cooking scrambles your intuition. Protein doesn’t disappear in the pan, but water does. When moisture leaves, the breast weighs less, so the protein per ounce looks higher even though the total protein in that piece is basically tied to the original amount of meat. If you log cooked ounces using a raw-based entry (common in apps and labels), your “accurate” tracking can quietly skew.
Even before heat, brands can differ. Some chicken is “enhanced” with added solution (brine), which increases raw weight without adding protein in the same proportion. Add in competing databases and label rounding, and it makes more sense to treat chicken breast protein as a workable range—not a single fixed number.
Typical protein in common chicken breast portions
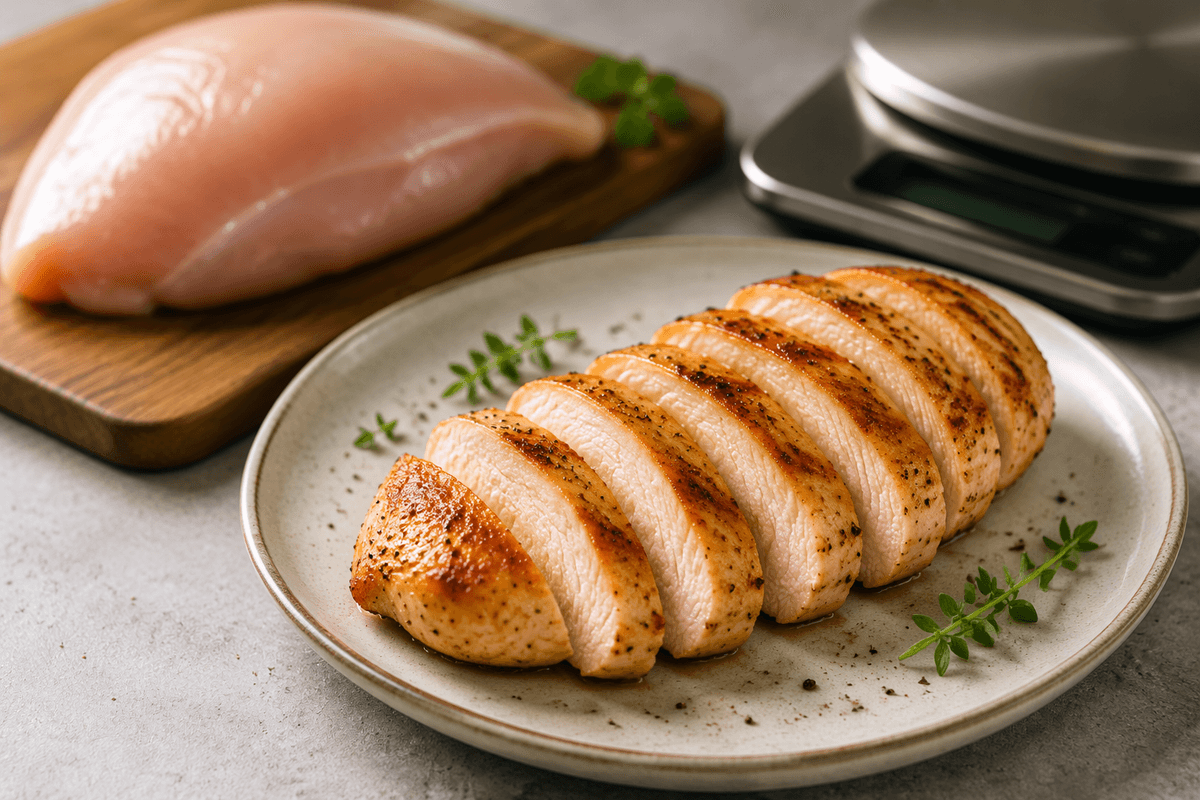
The first time you portion chicken for the week, the “one breast” idea tends to fall apart on the cutting board. Two pieces from the same pack can look similar, but one is noticeably thicker, or it has more meat tucked under the smooth side. That’s usually the moment people realize their logged protein is riding on portion assumptions more than they thought.
In everyday macro tracking, a helpful mental range is that chicken breast lands around 7–9 grams of protein per cooked ounce, depending on how much water cooked off and how the piece was trimmed. That puts a 4 oz cooked portion roughly in the 28–36 g zone, while 6 oz cooked often ends up around 42–54 g. If you’re measuring raw weight instead, the per-ounce number is usually lower because you’re weighing extra water that may not stay through cooking.
The “portion size” isn’t just ounces—it’s also density. A breast that was more heavily brined can start heavier raw but deliver a slightly lower protein-per-ounce impression once you compare it to a drier, air-chilled piece. Over time, those small shifts are what make a single fixed number feel oddly unreliable.
Raw versus cooked weight creates tracking confusion
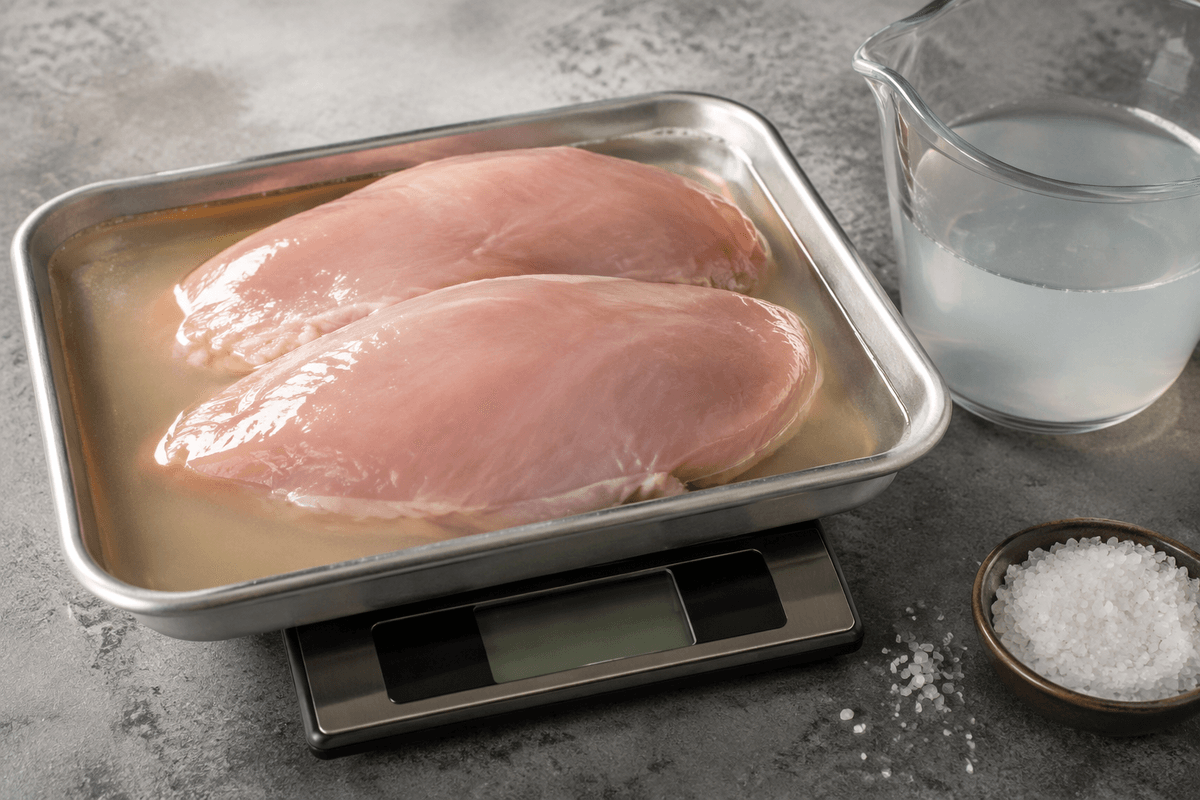
The confusion usually shows up after cooking, when you go to log what you actually ate. The breast that was 10–12 oz in the package might land at 7–9 oz on your plate, and it can feel like the protein “changed.” What changed is mostly water. If you weighed it raw but ate it cooked (or vice versa), the entry you pick in an app can quietly double-count or undercount that water loss.
Most label-style numbers and many database entries assume a raw weight unless they explicitly say “cooked.” That’s why a cooked-only weigh-in can look “higher protein per ounce” on paper: you’re dividing the same protein by fewer ounces. The mismatch gets worse when moisture loss is extreme—high heat, longer cook times, or cutting into the breast early so steam escapes—because the cooked weight shrinks more than you expected.
It’s also easy to miss how “enhanced” chicken plays into this. Added solution can inflate the raw scale reading, so if you log raw ounces from a brined breast using a generic entry, the estimate may run optimistic. The protein in that piece is still real, but the math starts to wobble when the weight you’re logging isn’t the weight the database had in mind.
Size, trimming, and cut change the final total
You notice it when one breast barely fits the skillet and the other looks like it came from a different bird. Even if you log both as “chicken breast, cooked,” the bigger piece simply contains more muscle tissue, so the total protein climbs with it. The catch is that many apps treat “1 breast” as a tidy serving size, while your package might range from small, tapered cuts to thick, heavy ones that are closer to two servings in practice.
Trimming changes the math in a quieter way. If you cut off visible fat, remove the tenderloin strip, or slice away ragged edges after cooking, you’re not just changing weight—you’re changing what portion you’re actually eating. A neatly trimmed, uniform breast tends to track closer to expectations, while a breast with tenderloin attached (or one that’s been butterflied thin) can swing your logged estimate because the cut you weighed isn’t the cut the database assumed.
That’s why two “6 oz” portions can land differently: one might be dense, clean breast meat, and another might include extra bits you didn’t finish. It isn’t a huge mystery—it’s just portion reality showing up in the numbers.
Cooking method shifts protein per ounce, not protein itself
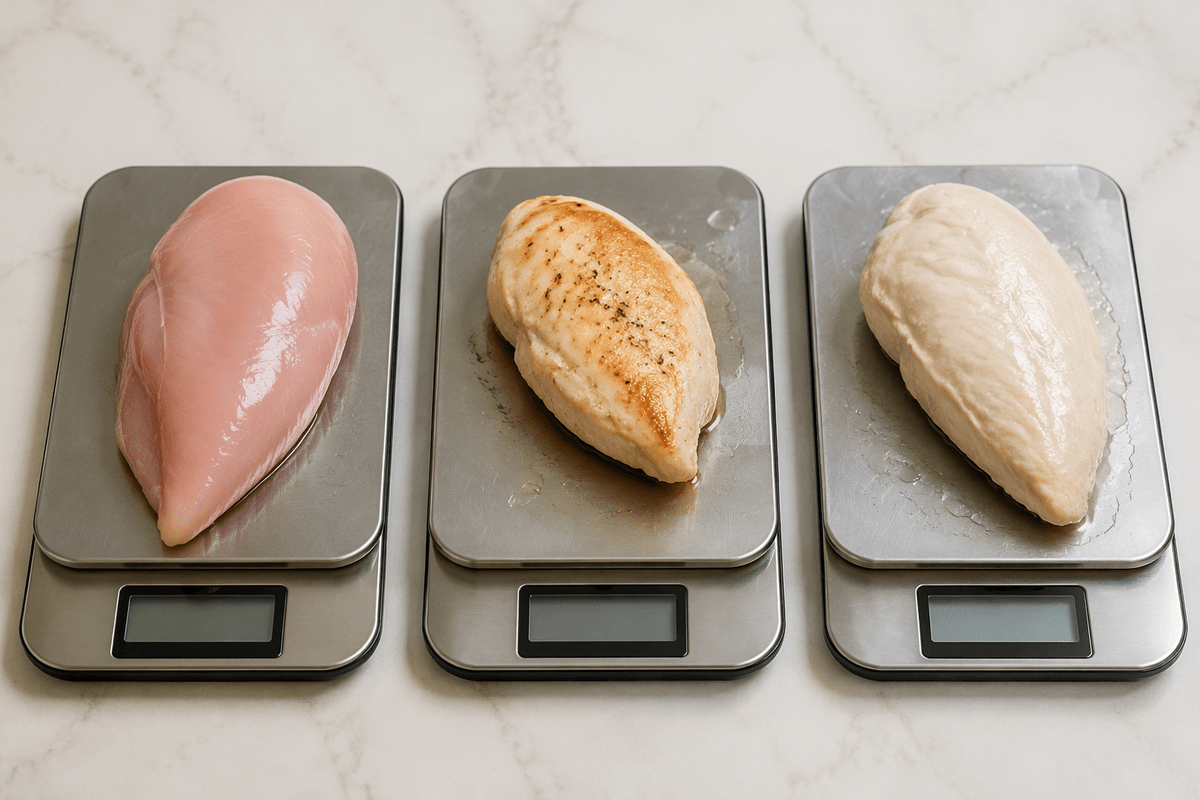
You can feel it when you slice into one breast and it looks almost “spongy” and juicy, while another one—same weight going into the pan—comes out firmer and noticeably smaller. That smaller one didn’t suddenly gain protein. It just lost more water and rendered juices, so the protein per cooked ounce looks higher because you’re weighing less leftover moisture.
Dry-heat methods like grilling, roasting, air frying, or a hard sear tend to drive off more water than gentler methods, so cooked weight shrinks more. Poaching or a saucier braise can leave more water in (or on) the meat, making the cooked ounces “heavier” and the protein-per-ounce number look lower. This is where tracking gets inconsistent: two people can both eat the same raw-sized breast, but the one who cooked it drier will log fewer cooked ounces and think they ate less—or pick a cooked entry and accidentally inflate the estimate.
You don’t always know how much moisture was lost—especially if you cook in batches, rest it longer, or chop and mix it into something. That’s why protein feels stable at the piece level, but slippery once you start comparing cooked weights across methods.
Nutrition labels and databases can disagree noticeably
It usually hits when two numbers that should match are suddenly far apart: the package says one thing per 4 oz, your macro app says another for “chicken breast,” and a third entry calls it “cooked, roasted.” None of them look wildly wrong on their own, but they can’t all be right for the exact piece on your plate.
A lot of the disagreement comes from what the data is actually describing. Some listings are for raw, some are for cooked, and many don’t make that obvious—so you end up applying a cooked weight to a raw-based number (or the reverse). Labels also round, and databases may pull from different lab samples, different trimming assumptions, or different moisture levels, which is why “per ounce” protein can drift even when the food is basically the same.
And if you rotate brands, the gap can widen. “Enhanced” chicken that carries added solution may look heavier raw without bringing the same protein per ounce, while air-chilled or drier packs can read more protein-dense once cooked. You can do everything “right” and still see inconsistency—because the reference point keeps shifting underneath the entry you picked.
A reasonable “healthy” choice that backfires in calculations
It’s the kind of meal that feels “safe”: a big chicken breast, some rice, maybe a salad, and you log it quickly because it’s just chicken. The backfire happens when that “big breast” is actually 10–12 oz raw, but the app entry you tap is built around a tidy 4 oz serving. On paper you ate one portion; in reality you may have eaten closer to two, and the protein gap shows up later as a mysteriously “low” day.
Sometimes it flips the other way. You cook the breast hard until it’s firm and smaller, then weigh only the cooked piece and choose a raw-based entry because it’s the first one that appears. Now the water loss gets counted like meat, and your logged protein looks higher than what that portion likely delivered. Nothing about the meal changed—just the reference point your math quietly depended on.
That’s why chicken can feel both consistent in the kitchen and inconsistent in the tracker: the healthiest-looking default is often the one most sensitive to portion size and raw-versus-cooked assumptions.
Getting a consistent estimate without overthinking it
It’s usually the second weigh-in that makes people doubt themselves: the chicken comes off the heat, you set it on the scale, and the number is nowhere near what you remember from the package. That’s not your tracker “being weird.” It’s the same piece moving between two different measuring worlds—raw weight that includes more water, and cooked weight that reflects how much of that water left.
If you want consistency without turning dinner into a lab, pick one approach and stick to it. Either log raw ounces using a raw entry (most label-style listings) or log cooked ounces using a cooked entry, but avoid mixing them day to day. When you can’t tell which entry you’ve got, treating cooked chicken breast as roughly 7–9 g protein per cooked ounce keeps you in a realistic range, then adjust your expectations when the cut is unusually large, heavily “enhanced,” or cooked noticeably dry.
The quiet win is noticing patterns instead of chasing a perfect number: the same brand, similar thickness, and the same cooking method will usually give you the most repeatable logs—even if the exact grams still wobble a little.